The United Kingdom (UK) is the largest producer of oil and the second-largest producer of natural gas in the European Union. The United Kingdom (UK) is the fifth-largest economy in the world in terms of gross domestic product. Following years as a net exporter of crude oil and natural gas, the UK
became a net importer of both fuels in 2004 and 2005, respectively. Production from UK oil and natural gas fields peaked in the late 1990s and has generally declined over the past several years as the discovery of new reserves and new production has not kept pace with the maturation of existing fields. Production of petroleum and other liquids increased in 2015, as investments made when oil prices were high came to fruition, but the UK remains a net importer.
The UK became a net importer of petroleum products in 2013, making it a net importer of all fossil fuels for the first time. Petroleum product imports increased in 2014. The UK government, aware of the country's increasing reliance on imported fuels, has developed key energy policies to address the domestic production declines. These policies include: using enhanced recovery from current and maturing oil and natural gas fields, promoting energy efficiency, decreasing the use of fossil fuels and thus reliance on imports, promoting energy trade cooperation with Norway, and decarbonizing the UK economy by investing heavily in renewable energy. However, for the UK to decarbonize its economy, the country needs large investments in energy infrastructure.
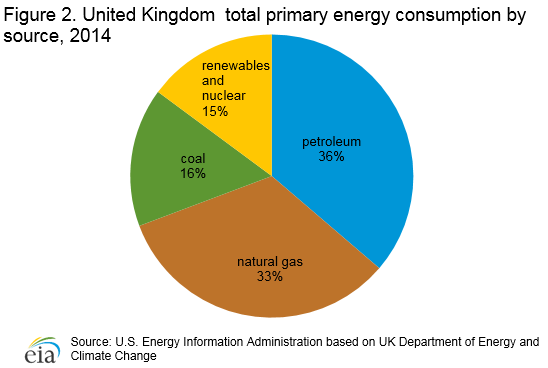
Renewable energy use, particularly in the electric power sector, has more than doubled over the past decade (2005-14). However, petroleum and natural gas continue to account for most of UK's energy consumption. In 2014, petroleum and natural gas accounted for 36% and 33%, respectively, of total energy consumption (Figure 2).1 Coal also continues to be a significant part of total energy consumption (16% in 2014).
Energy use per unit of gross domestic product (GDP) in the UK is one of the lowest among western economies. The UK has seen total primary energy consumption decline by almost 20% over the past decade (2005-14). This decline resulted from smaller contribution of energy-intensive industry to the economy, economic contraction, and improvements in energy efficiency.
 Petroleum and other liquids
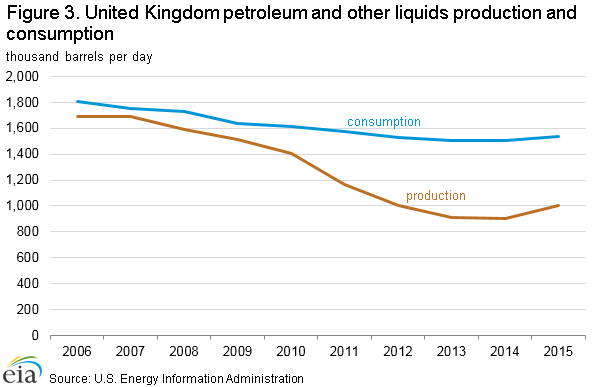
The UK's oil production and consumption have been on a long-term declining trend, although preliminary 2015 data indicate a pause in this trend.
Oil consumption in the UK peaked in 2005. Both production, which peaked earlier, and consumption have generally been declining since then. Since 2010, production has fallen at a faster pace than consumption, making the UK increasingly reliant on imports of both crude oil and petroleum products. However, the U.S. Energy Information Administration's preliminary estimates show that oil production increased by 100,000 b/d in 2015, while consumption stayed relatively flat (Figure 3). The UK has been a net importer of crude oil since 2005 and in 2013, the country also became a net importer of petroleum products.
 Sector organization
The UK government has decreased tax rates for the oil and natural gas sector to encourage investment by making UK projects more competitive.
The UK government does not hold a direct interest in oil production, but the sector remains important to the government because of its contributions to the overall economy and to government tax revenues. Taxes on UK Continental Shelf (UKCS) production totaled about £2.2 billion in fiscal year 2014-15.
In 2011, the UK government implemented several changes in tax structures and rates that applied to production from the UKCS. Collectively, these changes significantly increased tax rates on the oil and natural gas industry in the UK. Higher tax rates along with high operating and decommissioning costs for fields in the North Sea made UKCS projects less competitive. A report commissioned by the UK government in 2013 recommended adopting a strategy for Maximizing Economic Recovery (MER) from the UKCS. The government's implementation of the report's recommendations has included decreases in the tax rates on UK oil and natural gas production in 2015 and 2016, including tax incentives for a broad range of investments. As of January 1, 2016, the new tax regime imposes marginal tax rates on profits from oil and natural gas production between 30% and 67.5%, further lowering the maximum rate of 81% implemented under the 2011 tax changes.
Another effect of the UK government's MER strategy was the establishment of the Oil and Gas Authority (OGA) on April 1, 2015. The OGA was established as an executive agency of the UK's Department of Energy & Climate Change (DECC) and will later gain more autonomy, becoming a government owned company. The OGA will take over many of the DECC's current responsibilities, including issuing oil and natural gas licenses and collecting data from license holders. The OGA will have additional powers and tools beyond those currently available to the DECC, including the establishment of a dispute resolution process and the ability to attend industry meetings.
Exploration and production
UK total petroleum and other liquids production was essentially flat between 2013 and 2014, but preliminary data for 2015 indicate an increase in production.
The UK's petroleum and other liquids production peaked in 1986 and again in 1999 after oil companies developed a number of oil fields in the North Sea. After 1999, petroleum and other liquids production in the UK declined at an average annual rate of 8% through 2013. The production decline slowed in 2014 as production fell year-over-year by only 1% to average 900,000 barrels per day (b/d). Preliminary data for 2015 indicate that production increased by 10% to average 1 million b/d.
Much of the increase in production in 2015 is attributable to new fields brought online in 2014 and 2015. Petroleum development projects in the North Sea generally have long lead times, meaning that production from a new field occurs several years after the decision to develop that field. Thus, the increase in production in 2015 is mainly a result of investment decisions made several years ago, when Brent crude oil prices were much higher.
Although production in the UK has not yet responded to lower oil prices, investment in the UK's oil and natural gas industry is declining. This decline will likely lead to lower production in the future.
According to the Oil & Gas Journal (OGJ), the UK had 2.8 billion barrels of proved crude oil reserves as of the end of 2015, the most of any European Union (EU) member country but almost 8% below the level at the end of 2014.4 One major project, the Mariner field discovered in 1981, is currently under development and will offset some of the decline in reserves. The UK DECC approved development of the field in February 2013, and startup for the field had been planned for 2017. However, in late 2015, Statoil announced that it was delaying the expected startup date to the second half of 2018. The Mariner field is expected to produce a total of 250 million barrels of heavy crude oil over 30 years, with annual plateau production of about 55,000 b/d.
Most of the UK's reserves are located offshore on the UKCS, and most of the liquids production occurs in the central and northern sections of the North Sea. Reserves are generally found in smaller fields, with only a third of fields having more than 50 million barrels of oil.
The Weald shale basin is located onshore in southern England, and could hold large quantities of recoverable liquids. In 2015, a UK exploration company drilled a well in the Weald basin near London's Gatwick airport and reported very positive preliminary results. However, exploration of the basin is still in its early days. Estimates of in-place resources in the Weald basin vary widely, and it is still undetermined how much of the resource, if any, can be recovered economically.
Oil grades
Three main grades of oil are produced in the UK: Flotta, Forties, and Brent blends. They are generally light and sweet, which makes them attractive to foreign buyers. Flotta is the smallest and lowest quality (37.1° API and 0.92% sulfur) stream produced in the UK. Flotta crude is loaded at the Talisman Energy-operated Flotta terminal in the Orkney Islands, Scotland.
Forties blend is made up of oil from more than 50 fields spread over a large area of the North Sea, the biggest of which is the Buzzard oil field. Forties blend is a light (about 39° API) sweet (about 0.7% sulfur) crude, but the overall quality can vary based on Buzzard field volumes, which are heavier (32.6° API) and more sour (1.44% sulfur) than the rest of the blend volumes. The Forties system occupies most of the Central North Sea, located south of the Brent complex and east of Flotta. Once produced, Forties blend is shipped via the 170-kilometer pipeline to Cruden Bay, Scotland where it is pumped another 200 kilometers to Hound Point, at the Forties' loading port, also in Scotland.
Brent blend is a light (37.6° API), sweet crude (0.40% sulfur). More than two dozen UK fields contribute to the blend, although very little production comes from the once-prolific Brent field, after which the stream was named. The Brent blend is transported to the Sullom Voe terminal via pipelines. This terminal, located in Scotland's Shetland Islands, is operated by BP on behalf of a consortium of companies. Despite the declining physical volumes associated with the Brent blend, its importance as a financial benchmark is increasing.7
Brent benchmark crude
A benchmark crude is a specific crude oil that is widely and actively bought and sold, and to which other types of crude oil can be compared to determine a price by an agreed-upon differential. Brent, the most widely used global crude oil benchmark, is composed of four crude blends: Brent, Forties, Ekofisk, and Oseberg (BFOE). The Brent and Forties blends are produced offshore in the waters of the UK, and the Ekofisk and Oseberg blends are mainly produced offshore in the waters of Norway.
The Brent benchmark was originally based on the output of the Brent field, a single field in the UK's sector of the North Sea. At its peak in 1984, the Brent field alone produced more than 400,000 b/d from four platforms. During the late 1980s, production declined rapidly, and after a brief resurgence in the early 1990s, the declines resumed. In 2014, production ceased from two out of the three remaining, operating platforms in the Brent field. Production from the single remaining platform in 2015 has averaged less than 1,000 b/d and is likely to be shut down in the near future leaving the Brent blend to continue on with no Brent crude.
As production from the Brent field declined, other fields and blends were added. Today the Brent benchmark encompasses the four BFOE crude blends, most of which are also now in decline. Even though the benchmark itself accounts for only a small portion of total world crude production, it remains a key indicator for world crude oil pricing.
UK's oil fields and operators
Nexen was the largest field operator in the UK in terms of oil production. As of the end of 2015, Nexen operated eight fields in the UK, which combined produced about 187,000 bpd in 2014. Nexen-operated fields accounted for about 24% of total UK production in 2014.
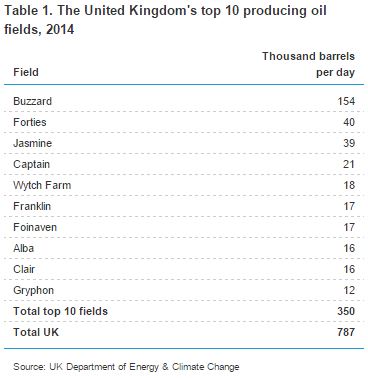
The UK's largest producing field in 2014 was the Nexen-operated Buzzard oil field, which produced an average of slightly more than 154,000 b/d during the year (Table 1).8 Buzzard field came online in 2007 and reached full capacity of 200,000 b/d in 2008. Average annual production at the field declined every year until 2013, when Nexen was able to reverse some of the declines. Production in 2014 was 15% lower than in 2013, mainly because of extensive maintenance-related outages. Reliability at the field was better in 2015, and production in the first nine months of the year averaged about 168,000 b/d.
 Consumption and imports
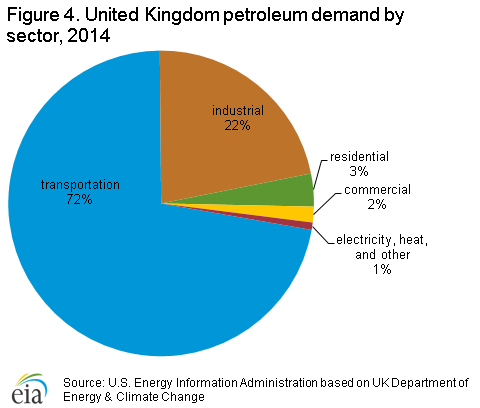
In 2014, the UK consumed 1.5 million b/d of petroleum and other liquids, similar to consumption in 2013 and similar to preliminary estimates for 2015. Consumption peaked in 2005 at 1.8 million b/d and declined gradually to slightly more than 1.5 million b/d in 2013. The transportation and industrial sectors account for more than 90% of petroleum consumption (Figure 4).
Demand for middle distillates, in particular diesel and aviation fuel, has steadily increased in the UK. Distillate fuel oil accounted for 34% of UK consumption, and kerosene jet fuel accounted for 17% in 2014. Motor gasoline accounted for another 19%. Demand for motor gasoline has fallen gradually since 1990 as more drivers switch to diesel vehicles and as vehicle efficiency increases.
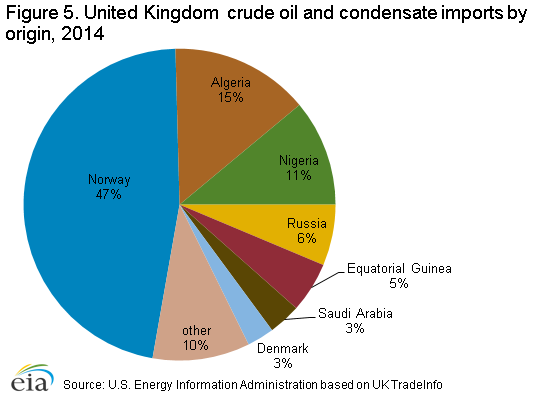
The United Kingdom's domestic refining sector is a significant crude oil importer, receiving about 1 million b/d in 2014. Norway supplied 47% of the UK's imports of crude oil in 2014, and EU countries supplied an additional 3%. African countries, particularly Algeria and Nigeria, supplied 37% of crude oil imports. The Middle East and the Americas each supplied 3%. Other Europe and Eurasia supplied 7%, with most of that coming from Russia (figure 5).
Exports
Despite the large declines in oil production over the past few years, the UK is still one of the largest petroleum producers and exporters in Europe. The country exported about 600,000 b/d of crude oil in 2014, according to the UK DECC.
Once a major exporter of oil, the UK exports have dropped along with decreasing domestic production. UK crude exports peaked in 2000 at 1.9 million b/d, declining to 600,000 b/d in 2014. However, despite being a net importer of crude oil and petroleum products, the UK is still one of the largest petroleum producers and exporters in Europe.
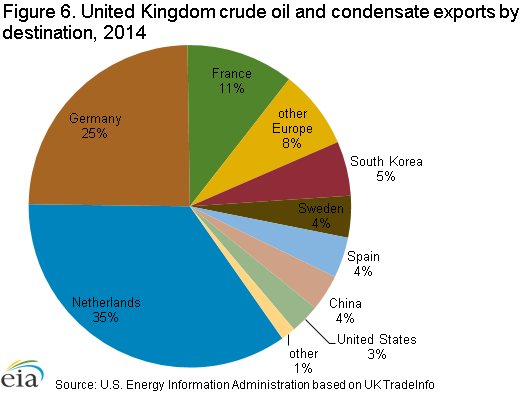
Most of the country's crude oil exports (86%) went to EU countries, mainly the Netherlands and Germany. The bulk of the exports to Germany are for refining and consumption there, while exports to the Netherlands include oil destined for further trade to other countries. Most of the non-EU export trade was with Asia (9%) and the United States (Figure 6).
 Pipelines
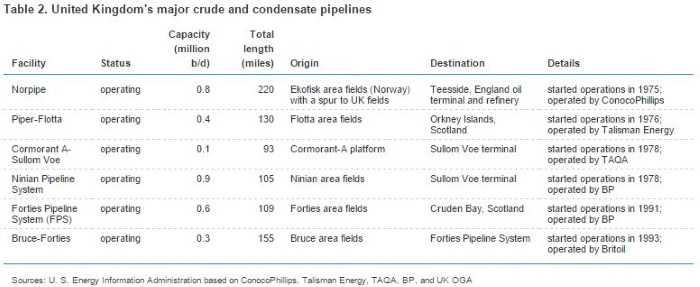
There is an extensive network of pipelines in the UK that carries oil extracted from North Sea platforms to coastal terminals in Scotland and in northern England. The network includes six major pipelines (Table 2).13 There are many smaller pipelines that transport petroleum liquids from individual fields to the major pipelines for transport to shore. Pipelines in the UK are privately owned and operated, however any qualified shipper can access the pipelines.
 Refining sector
The UK had 1.4 million b/d of refining capacity at the end of 2015, according to OGJ.14 In 2014, a 100,000 b/d refinery in Milford Haven, Wales, closed and has since been turned into a storage facility. Refinery output decreased by 7.4% from 2013 to 2014.15
After a long period as a net exporter of petroleum products, the UK became a net importer of petroleum products in 2013, with total net product imports growing to 128,000 b/d in 2014. UK refineries produce more gasoline and fuel oil than is demanded domestically, so the UK remains a net exporter of these products. However, because UK refineries cannot meet local demand for many other fuels including diesel, imports continue to grow. Net diesel imports in 2014 were almost 196,000 b/d, up about 30% from the 2013 level. In 2014, net imports of diesel accounted for 42% of total UK diesel demand.16 The largest source of imported diesel is Russia, accounting for slightly more than one-third of total diesel imports in 2014. Sweden accounted for 17% of UK diesel imports, and the Netherlands and the United States each accounted for 13%.
Natural gas
The UK's natural gas production and consumption have been on a long-term declining trend, however in recent years both have been flat or have increased modestly.
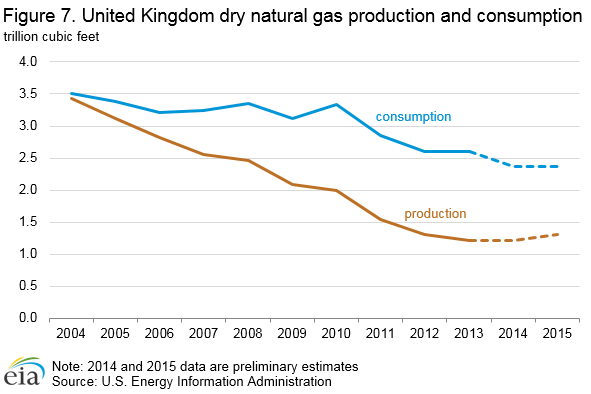
UK natural gas production peaked in 2000, and consumption peaked in 2004. Since then, natural gas production and consumption have both generally been declining (figure 7). Preliminary data for 2015 show a pause in the long-term trend with natural gas consumption near flat and production growing.
 Sector organization
The UK natural gas sector is fully privatized, including production, transmission, and distribution. The largest natural gas distributor in the UK is Centrica, a spin-off of the distribution assets of formally state-owned British Gas. Centrica had a 40% market share in the UK natural gas market in 2013, according to the UK Office of gas and electricity markets (Ofgem). There are five other large suppliers (E. On, NPower, SSE, Scottish Power, and EDF) that in 2013 each had a market share of between 10% and16%.18
The UK natural gas distribution sector underwent a major change in 2005, when National Grid Gas sold four of the eight gas distribution networks to Scotia Gas Networks, Wales and West Utilities, and Northern Gas Networks. Prior to this sale, National Grid controlled the domestic natural gas distribution system.
Exploration and production
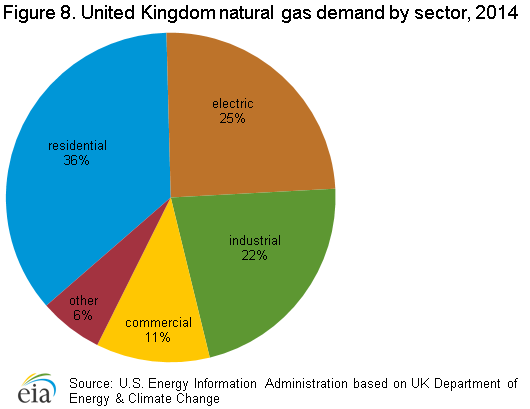
According to Oil & Gas Journal,the UK held an estimated 7.3 trillion cubic feet (Tcf) of proved natural gas reserves as of January 2016.19 Indigenous UK natural gas production accounted for 47% of total natural gas supply (figure 8).20 Most of the leading oil companies in the UK are also the leading natural gas producers, including BP, Shell, and ConocoPhillips.
Most of the UK's natural gas production comes from offshore liquids fields, accounting for 55% of total gross natural gas production in 2014. Natural gas production from these associated fields increased by more than 3% between 2013 and 2014. Natural gas from offshore dry gas fields accounted for almost 45% of production in 2014, and onshore fields accounted for less than 1% of total gross natural gas production.
UK natural gas production peaked in 2000 at 3.8 Tcf. From 2000 to 2013 production declined at an average rate of more than 8% per year. High oil and natural gas prices before and during 2014 helped spur high levels of investment in North Sea assets over the past several years. Investments made during the past few years have resulted in production increases in 2014 and 2015 (figure 7). Natural gas production in 2014 was only marginally (0.1%) higher than in 2013. However, production in the first three quarters of 2015 was 6.8% higher than during the same period in 2014.
 Shale
Shale
Estimates of natural gas and liquids resources in shale formations in the UK vary considerably. Shale testing is still at an early phase in the UK, and compared with North America, the shale geology of the UK is considerably more complex. The two formations that have received the most attention so far are the Bowland shales, which are present throughout parts of northwest, central, and eastern England and the Weald basin in southern England. The Bowland shales are more likely to hold natural gas, and the Weald is more likely to hold liquid hydrocarbons.
In 2011, hydraulic fracturing at a shale well in the Bowland basin triggered two minor earthquakes. The UK government had imposed a moratorium on hydraulic fracturing, but in December 2012, the government imposed additional requirements for monitoring and controls and allowed shale drilling and fracturing to resume. Companies must receive permission from the UK government as well as from local council governments before they can drill or fracture any new wells. Although the UK government is supportive of shale exploration and development activities, companies have often faced opposition from local councils or environmental groups.
Consumption, imports, and exports
Natural gas consumption in the UK was slightly less than 2.5 Tcf in 2014, a 9% decline from the level in 2013. Residential natural gas consumption, much of which is for home heating, accounted for 36% of total consumption in 2014 (Figure 9)23 and was down almost 19% from the 2013 level. Much of the decline in residential natural gas consumption is attributable to a colder-than-average winter in 2013 and a warmer-than-average winter in 2014. Natural gas consumption in the industrial sector also declined in 2014, down 4% from the 2013 level. Although natural gas consumption in the public electricity sector increased by more than 8%.
In 2004, the UK became a net importer of natural gas. The UK imported 1.5 Tcf of natural gas in 2014, with about three quarters imported via pipelines and the rest imported as liquefied natural gas (LNG). Pipeline imports from Norway and LNG imports from Qatar combined accounted for more than 80% of total imports. The UK also exports natural gas to the European continent and to the Republic of Ireland via pipeline. In 2014, UK natural gas exports totaled 0.4 Tcf.

Liquefied natural gas (LNG)
The UK received the world's first trans-oceanic delivery of LNG in January 1959 and the world's first commercial LNG cargo in October 1964. The UK continued imports of LNG until the early 1980s when growing North Sea natural gas production supplanted imports. However, growing natural gas demand and falling North Sea production led to the construction of new LNG import terminals and the resumption of LNG imports in 2005. Currently, the UK has four LNG import terminals with total import capacity of 1.9 Tcf per year.25 Over the past five years, average utilization rates have been low, about 28%. However, LNG imports can vary considerably from month-to-month and from year-to-year in response to changing UK, European, and global market conditions. In early 2011, utilization rates were more than 50%, before the Fukushima disaster increased demand for LNG in Japan, leading to a tighter global LNG market. By the end of 2011, utilization rates at UK LNG terminals fell to about 30% as more LNG cargoes were directed to Asia.
In 2014, the UK imported 399 billion cubic feet (Bcf) of LNG, up 20% from 2013, a trend that is expected to continue. LNG imports into the UK from January through October in 2015 were 23% higher than during the same period in 2014.26 Qatar is by far the largest source of LNG imported into the UK, accounting for more than 90% of LNG imports each year since 2012.
In 2015, the UK's Grain LNG successfully tested the ability to load previously imported LNG back onto ships, and plans to offer the service commercially by the end of 2016. Grain LNG is currently the only UK LNG terminal with the ability to reload LNG onto ships either for re-export in bulk or for distribution on smaller ships for use as a marine fuel.
In March 2013, Centrica signed a 20-year contract with Cheniere Energy to buy LNG from train 5 of the Sabine Pass LNG facility in Louisiana. Construction of train 5 started in June 2015, and it is scheduled to be online by the end of 2019. Centrica is contracted to buy about 1.75 million metric tons of LNG (89 Bcf of natural gas) from Cheniere per year and has import capacity rights at the UK's Isle of Grain LNG terminal.
Pipelines
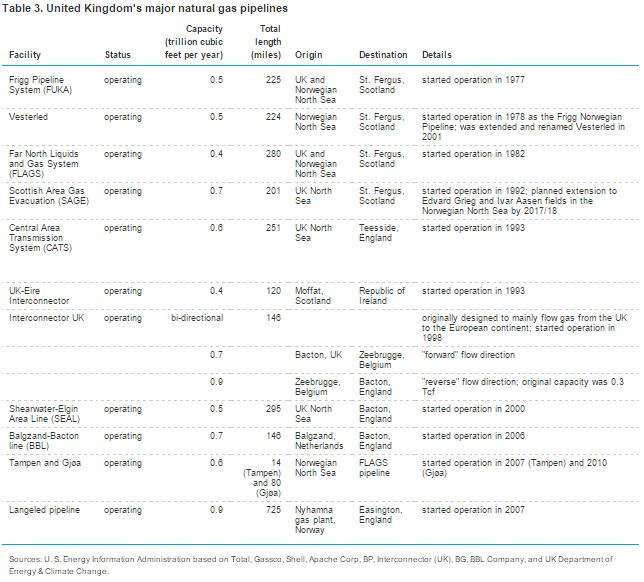
There are six main pipeline systems that carry natural gas from UK and Norwegian offshore platforms to coastal landing terminals (Table 3).30 The UK also has two natural gas pipeline interconnections with the Republic of Ireland, an undersea link from Scotland and a smaller capacity link from Northern Ireland. Additionally, the UK has two pipeline connections with continental Europe, including the Interconnector pipeline, which is bi-directional.
 Coal
Coal
Coal production in the UK is declining as a result of falling consumption, relatively cheap natural gas that competes with coal for power generation, and a surge of low-cost coal imports.
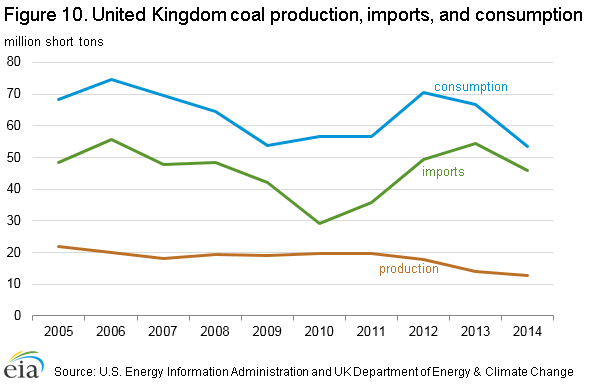
Coal production in the UK has been declining since the early 1900s, falling from 322 million short tons (MMst) in 1913 (the first year for which annual data are available) to a record low of 12.8 million short tons (MMst) in 2014 (Figure 10).
Coal Consumption in the UK peaked at 244 MMst in 1956, the year in which the UK enacted the Clean Air Act. The Clean Air Act was prompted by the great London smog of 1952 and prohibited the emission of dark smoke from industrial buildings, private homes, and railroad locomotives. At the time, industrial coal use accounted for more than half of total UK coal consumption, and railroad and home use accounted for almost a quarter of total coal consumption. The remaining coal consumption was mainly in the electric sector where coal consumption did not peak until the 1980s at slightly less than 100 MMst. Coal consumption in 2014 was 53 MMst, almost 80% of which was used in the electric sector.
Environmental regulations, competing fuels, and competing supply sources have been the main drivers of coal's long decline in the UK. Natural gas began replacing coal in the 1970s when natural gas production started in the North Sea. In the 1990s coal's displacement by natural gas accelerated as regulatory changes opened the electric sector to more investment in natural gas-fired generation capacity. Coal consumption experienced a brief resurgence in 2012, growing 14 MMst from 2011 levels. This resurgence did not extend to UK coal production but was instead accompanied by an uptick in imports. The availability of cheap coal from the United States was one of the main drivers in the growth of coal consumption, along with relatively high natural gas prices and low carbon prices. Coal consumption resumed its decline in 2013 and 2014, falling 6% and 20% respectively, as natural gas prices declined and as the UK's carbon floor price policy increased the cost of carbon emissions.
The UK had an estimated 251 MMst of recoverable coal reserves at the end of 2014, according to BP's Statistical Review of World Energy 2015.33 Deep coal mines had been operating in the UK since the 1800s. However the last deep coal mine in the UK closed in December 2015. Several surface mines remain in operation in the UK and are mainly located in central and northern England, south Wales, and central and southern Scotland.
 Electricity
Most of the electricity generated in the UK is generated from fossil fuels. However, electricity generated from renewable sources, especially wind, continues to grow.
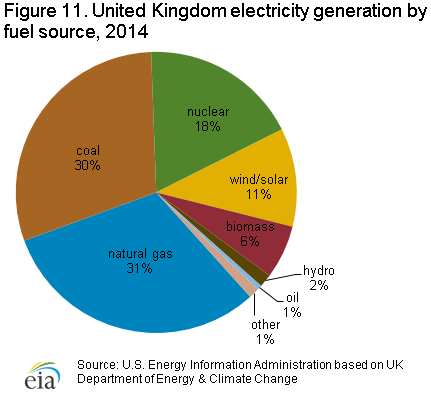
Most electricity generation in the UK comes from fossil fuels (Figure 11)34, particularly natural gas (31%) and coal (30%). The UK had 85 gigawatts (GW) of installed electricity generation capacity at the end of 2014. Capacity has fallen since 2010 as several fossil fuel-fired plants and a few nuclear reactors have shut down. In 2014, the UK generated 336 billion kilowatthours (kWh) of electricity while consuming 360 billion kWh, down 6% and 4%, respectively, from 2013 levels.
 Sector organization
The UK has a privatized electricity sector, where electric generators and marketers operate in a competitive environment. EDF Energy, a subsidiary of Électricité de France, was the largest supplier of electricity to the national transmission system in 2014, accounting for 26% of generation. The retail electric market is dominated by six large providers, with British gas accounting for about a quarter of the total market. The share of independent providers in the retail market is growing, accounting for about 10% of the market at the beginning of 2015, up from 1% at the beginning of 2012.35
The UK electric transmission system is regulated, and it is managed by independent system operators. The electric transmission systems of England, Wales, and Scotland are fully integrated and are operated as a single market by National Grid Electricity Transmission plc (National Grid), which also owns the electric transmission system in England and Wales. The electricity grid in Northern Ireland is integrated with that of the Republic of Ireland, and the combined system is operated by the Single Electricity Market Operator (SEMO). The UK transmission system has two interconnections with the Irish system, one between Scotland and Northern Ireland and one between Wales and the Republic of Ireland. The UK system also has two interconnections with continental Europe, one each with France and the Netherlands.36
The UK government's energy policies have long sought to encourage the use of low-carbon sources of energy to generate electricity. The Non Fossil Fuel Obligation (NFFO) was introduced in 1990 to support nuclear and renewables generation. In 2002, the UK replaced the NFFO with the Renewables Obligation (RO) that continued support for renewables generation but did not include support for nuclear generation. The government is phasing out the RO support system, and beginning in 2017, the main method of renewables support will be via feed-in tariffs (FIT) implemented as contracts for difference (CfD). A FIT offers a guaranteed price for electricity generated by qualifying generation projects. FITs can be implemented in a variety of ways (see Feed in Tariff). Under the UK support system, once the government establishes a FIT—also called a strike price—for a project, the government and the project developer sign a long-term CfD contract. Under the CfD, when the market price for electricity is lower than the FIT price, the government pays the generation company the difference. If the market price is higher than the FIT price, the generation company must pay the government the difference. Projects that can qualify for support under this new system include renewables generation facilities as well as projects to build nuclear power plants and carbon capture and storage facilities.
Fossil fuel generation
The share of electricity from the burning of fossil fuels is declining as renewables generation increases.
Electricity generation power plants using fossil fuels have accounted for between 70% and 80% of total generation for most of the past 20 years, and they continue to provide the bulk of the electricity supply in the UK. In 2008, fossil fuel-fired generation peaked at 80% of total electricity supply and has since declined to 60% in 2014. At the same time, renewables generation has grown from 7% of total generation to 20% of total generation.
Natural gas- and coal-fired generation provide most of fossil fuel-fired generation as well as total generation. In 2014, each accounted for about 30% of total generation. Coal and natural gas have long competed for share of the electric generation market. The relative price of the two fuels and the costs for complying with environmental regulations at any given time have been the major factors influencing which fuel gains market share and which fuels loses market share. From 2009 to 2012, U.S. coal exports more than doubled, helping to push down global coal prices. Over the same period UK natural gas prices nearly doubled and carbon prices halved. Consequently, the share of coal-fired generation in total electricity generation increased by 12% while the share of natural gas declined by 17%. Since 2012, coal-fired generation has lost market share as several coal-fired power plants have been shut down. Oil-fired power plants continue to provide only marginal amounts of electricity, accounting for less than 1% of total generation in 2014.
Nuclear
Currently accounting for just below one-fifth of total electricity generation, nuclear power plants are central to the UK government plans for future electricity generation.
There were 15 operating nuclear reactors in the UK at the end of 2014, with a current capacity of slightly less than 9 gigawatt electric (GWe), according to the World Nuclear Association. All 15 operating reactors are owned and operated by EDF Energy, a subsidiary of Électricité de France. Most of the existing nuclear capacity started operations in the 1970s or 1980s and is due to be shut down by 2023.37 Nuclear power generation accounted for 18% of the country's total net generation in 2014, according to the DECC.38
In the 1990s and early 2000s, the UK government viewed new nuclear capacity as unappealing because of its economic costs and the problem of disposing of nuclear waste.39 Government policies began to shift towards support for new nuclear capacity beginning in 2006, with the release of a government energy white paper declaring that nuclear generation could make a significant contribution to meeting the country's energy goals. Recent government policy statements project that the UK will need an additional 25 GWe of new nonrenewable generating capacity by 2030, and that a significant portion of this capacity should come from new nuclear facilities.
The Hinkley Point C project is expected to be the first new nuclear facility to come online in the UK since 1995. The Hinkley Point C project is being led by EDF Energy, with China General Nuclear Power Corporation (CGN) taking a minority stake in the project. The project includes building two new reactors at the existing Hinkley Point nuclear site. The two reactors will have a combined capacity of 3.2 GWe. The target start date for the first reactor was originally 2017, but the schedule has slipped. The current target for startup is 2023. In October 2013, the UK government agreed a CfD with EDF Energy guaranteeing a price of £92.50 per MWh for power generated by the Hinkley Point C project. In 2015, wholesale power prices in the UK were less than £50 per MWh. EDF Energy and CGN plan to make a final investment decision on the project in early 2016.
Including the two reactors for the Hinkley Point C project, a total of 13 new nuclear units are planned or proposed for the UK with a total capacity of almost 18 GWe of generating capacity.40
Source: EIA