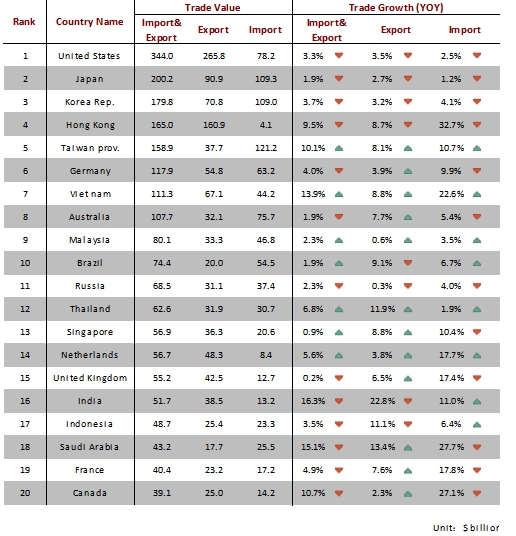
In August 2020, the Maritime Silk Road Trade Index (STI) released by the Ningbo Shipping Exchange showed that the import and export trade index was 143.94 points, down 0.32% from the previous month and up 4.26% year-on-year; the export trade index was 163.11 points, down 1.00% from the previous month , An increase of 9.53% year-on-year; the import trade index was 124.43 points, up 0.59% month-on-month and down 2.02% year-on-year.

From January to August, China total import and export trade value was US$2,853.519 billion, a year-on-year decrease of 3.39%. Among them: the total export trade value was US$1571.138 billion, a year-on-year decrease of 2.29%; the total import trade value was US$1282.381 billion, a year-on-year decrease of 4.71%.
China’s trade with continents
From January to August, the import and export trade value between China and Asia was US$1,469.7 billion, down 2.8% year-on-year, accounting for 51.5% of China’s total import and export value. The export trade value was 750.5 billion U.S. dollars, down 3.5% year-on-year; the import trade value was 719.3 billion U.S. dollars, down 2.1% year-on-year.

From January to August, the import and export trade value between China and Europe was US$562.1 billion, down 1.5% year-on-year, accounting for 19.7% of China’s total import and export value. The export trade value was 332.2 billion U.S. dollars, up 2.4% year-on-year; the import trade value was 229.9 billion U.S. dollars, down 6.8% year-on-year.
From January to August, the import and export trade value between China and Africa was US$116.4 billion, down 15.3% year-on-year, accounting for 4.1% of China’s total import and export value. The export trade value was 69.2 billion U.S. dollars, down 5.0% year-on-year; the import trade value was 47.2 billion U.S. dollars, down 27.0% year-on-year.

From January to August, the import and export trade value between China and North America was US$383.3 billion, a year-on-year decrease of 4.1%, accounting for 13.4% of China’s total import and export value. The export trade value was 290.8 billion U.S. dollars, down 3.0% year-on-year; the import trade value was 92.6 billion U.S. dollars, down 7.3% year-on-year.
From January to August, the import and export trade value between China and Latin America was US$195.9 billion, a year-on-year decrease of 4.2%, accounting for 6.9% of China’s total import and export value. The export trade value was 89.4 billion U.S. dollars, down 8.0% year-on-year; the import trade value was 106.6 billion U.S. dollars, down 0.8% year-on-year.
From January to August, the import and export trade value between China and Oceania was US$125.5 billion, down 1.8% year-on-year, accounting for 4.4% of China’s total import and export value. The export trade value was 39.1 billion U.S. dollars, up 8.4% year-on-year; the import trade value was 86.4 billion U.S. dollars, down 5.8% year-on-year.
Source: Ningbo Shipping Exchange