The Census and Statistics Department (C&SD) released the statistics on vessels, port cargo and containers for the second quarter of 2016.
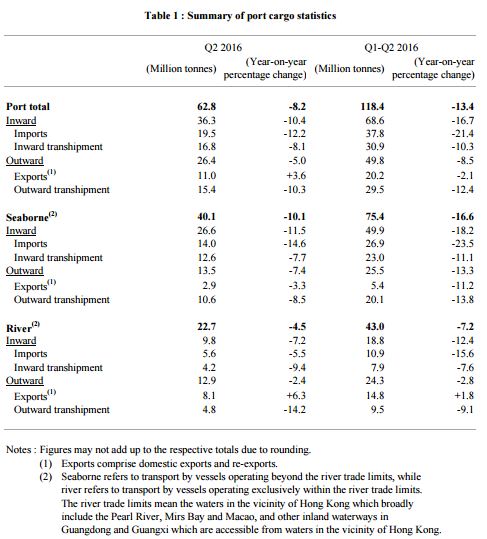
In the second quarter of 2016, total port cargo throughput decreased by 8.2% compared with a year earlier to 62.8 million tonnes. Within this total, inward and outward port cargo decreased by 10.4% and 5.0% compared with a year earlier to 36.3 million tonnes and 26.4 million tonnes respectively.
For the first half of 2016, total port cargo throughput decreased by 13.4% compared with a year earlier to 118.4 million tonnes. Within this total, inward and outward port cargo decreased by 16.7% and 8.5% compared with a year earlier to 68.6 million tonnes and 49.8 million tonnes respectively.
On a seasonally adjusted quarter-to-quarter comparison, total port cargo throughput increased by 4.2% in the second quarter of 2016.
Within this total, inward and outward port cargo increased by 2.7% and 6.2% respectively compared with the preceding quarter. The seasonally adjusted series enables more meaningful shorter-term comparison to be made for discerning possible variations in trends.
Port cargo
Within port cargo, seaborne and river cargo decreased by 10.1% and 4.5% in the second quarter of 2016 compared with a year earlier to 40.1 million tonnes and 22.7 million tonnes respectively.
Within inward port cargo, imports and inward transhipment decreased by 12.2% and 8.1% in the second quarter of 2016 compared with a year earlier to 19.5 million tonnes and 16.8 million tonnes respectively. For outward port cargo, exports (including domestic exports and re-exports) increased by 3.6% compared with a year earlier to 11.0 million tonnes, while outward transhipment decreased by 10.3% to 15.4 million tonnes.
Within port cargo, seaborne and river cargo decreased by 16.6% and 7.2% in the first half of 2016 compared with a year earlier to 75.4 million tonnes and 43.0 million tonnes respectively.
Within inward port cargo, imports and inward transhipment decreased by 21.4% and 10.3% in the first half of 2016 compared with a year earlier to 37.8 million tonnes and 30.9 million tonnes respectively.
For outward port cargo, exports and outward transhipment decreased by 2.1% and 12.4% compared with a year earlier to 20.2 million tonnes and 29.5 million tonnes respectively.
The detailed port cargo statistics are summarised in Table 1.
The main countries/territories of loading of inward port cargo and countries/territories of discharge of outward port cargo are shown in Table 2 and Table 3 respectively.
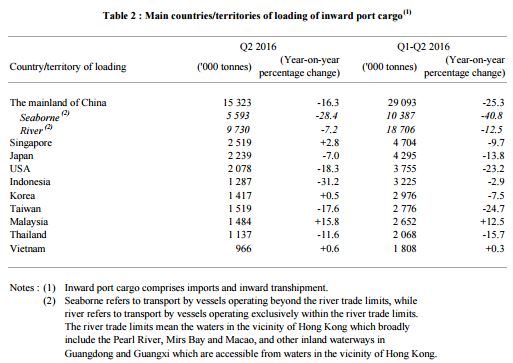

Comparing the second quarter of 2016 with the second quarter of 2015, a double-digit increase was recorded in the tonnage of inward port cargo loaded in Malaysia (+15.8%). On the other hand, double-digit decreases were recorded in the tonnage of inward port cargo loaded in Indonesia (-31.2%), the United States of America (-18.3%), Taiwan (-17.6%), the mainland of China (-16.3%) and Thailand (-11.6%). For outward port cargo, a triple-digit increase was recorded in the tonnage of outward port cargo discharged in Macao (+178.8%).
On the other hand, double-digit decreases were recorded in the tonnage of outward port cargo discharged in Malaysia (-19.0%), Japan (-11.7%), the mainland of China (-11.2%) and Korea (-10.8%).
Comparing the first half of 2016 with the first half of 2015, a double-digit increase was recorded in the tonnage of inward port cargo loaded in Malaysia (+12.5%). On the other hand, double-digit decreases were recorded in the tonnage of inward port cargo loaded in the mainland of China (-25.3%), Taiwan (-24.7%), the United States of America (-23.2%), Thailand (-15.7%) and Japan (-13.8%). For outward port cargo, a triple-digit increase was recorded in the tonnage of outward port cargo discharged in Macao (+116.9%).
On the other hand, double-digit decreases were recorded in the tonnage of outward port cargo discharged in Malaysia (-23.0%), Vietnam (-14.8%), Japan (-11.5%), Korea (-10.9%), the mainland of China (-10.5%) and the United States of America (-10.2%).
The principal commodities of inward and outward port cargo are shown in Table 4 and Table 5 respectively.


Comparing the second quarter of 2016 with the second quarter of 2015, double-digit changes were recorded in the tonnage of inward port cargo of “machinery” (-13.6%), “coal, coke and briquettes” (-13.8%) as well as “stone, sand and gravel” (-33.4%). As for outward port cargo, double-digit changes were recorded in the tonnage of “stone, sand and gravel” (+16.4%), “artificial resins and plastic materials” (-12.6%) and “pulp and waste paper” (-31.7%).
Comparing the first half of 2016 with the first half of 2015, double-digit changes were recorded in the tonnage of inward port cargo of “coal, coke and briquettes” (+15.6%), “machinery” (-14.5%) as well as “stone, sand and gravel” (-49.7%). As for outward port cargo, double-digit changes were recorded in the tonnage of “machinery” (-10.3%), “artificial resins and plastic materials” (-18.0%) and “pulp and waste paper” (-30.2%).
Containers
In the second quarter of 2016, the port of Hong Kong handled 4.87 million TEUs of containers, representing a decrease of 8.3% compared with a year earlier. Within this total, laden and empty containers decreased by 7.7% and 11.8% to 4.18 million TEUs and 0.69 million TEUs respectively.
Among laden containers, inward and outward containers dropped by 6.6% and 8.9% to 2.19 million TEUs and 1.99 million TEUs respectively.
For the first half of 2016, the port of Hong Kong handled 9.20 million TEUs of containers, representing a decrease of 10.1% compared with a year earlier. Within this total, laden and empty containers decreased by 10.1% and 10.5% to 7.84 million TEUs and 1.35 million TEUs respectively. Among laden containers, inward and outward containers dropped by 8.2% and 12.0% to 4.05 million TEUs and 3.80 million TEUs respectively.
On a seasonally adjusted quarter-to-quarter comparison, laden container throughput increased by 4.1% in the second quarter of 2016.
Within this total, inward and outward laden containers increased by 5.8% and 2.4% respectively.
In the second quarter of 2016, seaborne and river laden containers decreased by 5.8% and 12.3% compared with a year earlier to 3.05 million TEUs and 1.14 million TEUs respectively.
Within inward laden containers, imports and inward transhipment decreased by 6.4% and 6.7% in the second quarter of 2016 compared with a year earlier to 0.71 million TEUs and 1.48 million TEUs respectively. For outward laden containers, exports and outward transhipment decreased by 8.0% and 9.2% to 0.61 million TEUs and 1.38 million TEUs respectively.
In the first half of 2016, seaborne and river laden containers decreased by 10.8% and 8.1% compared with a year earlier to 5.63 million TEUs and 2.21 million TEUs respectively.
Within inward laden containers, imports and inward transhipment decreased by 7.4% and 8.6% in the first half of 2016 compared with a year earlier to 1.30 million TEUs and 2.75 million TEUs respectively. For outward laden containers, exports and outward transhipment decreased by 12.1% and 11.9% to 1.14 million TEUs and 2.66 million TEUs respectively.
The detailed container statistics are summarised in Table 6.

Port cargo and laden container statistics are compiled from a sample of consignments listed in the cargo manifests supplied by shipping companies and agents to the C&SD.
Vessel arrivals
Comparing the second quarter of 2016 with the second quarter of 2015, the number of ocean vessel arrivals decreased by 5.4% to 7 091, with the total capacity also decreasing by 3.2% to 101.2 million net registered tons.
The number of river vessel arrivals decreased by 2.7% to 39 268, while the total capacity increasing by 5.3% to 28.0 million net registered tons.
Comparing the first half of 2016 with the first half of 2015, the number of ocean vessel arrivals decreased by 7.2% to 13 793, with the total capacity also decreasing by 4.9% to 197.2 million net registered tons. The number of river vessel arrivals decreased by 3.0% to 77 180, while the total capacity increasing by 4.0% to 54.2 million net registered tons.
The statistics on vessel arrivals in Hong Kong are given in Table 7.

Vessel statistics are compiled by the Marine Department primarily from general declarations submitted by ship masters and authorised shipping agents. Pleasure vessels and fishing vessels plying exclusively within the river trade limits are excluded.
Further information
More detailed statistics on port cargo, containers and vessels will be published in the report “Hong Kong Shipping Statistics, Second Quarter 2016”.
Source: Hong Kong Government (HKSAR)