Recent and projected increases in U.S. crude production have sparked discussion about the implications of current limitations on crude oil exports for prices, including both world and domestic crude oil and petroleum product prices, and for the level of domestic crude production and refining activity.
In response to multiple requests, the U.S. Energy Information Administration is developing analyses that shed light on these issues. Studies completed since May 2014 have considered the characteristics of domestic crude production streams, price formation for gasoline and other petroleum products, tools to better track displacement of crude imports by domestic production, and technical options for processing additional light tight crude oil.
Given that some responses to the growth in production that has already occurred since 2011, including the like-for-like replacement of crude oil imports comparable in quality to new domestic streams, are inherently limited going forward, the question of how domestic and international markets for both crude and products might evolve in scenarios with and without a relaxation in current limitations on crude oil exports continues to hold great interest for policymakers, industry, and the public.
Recognizing that refiner responses beyond like-for-like substitution are an important pathway to increasing the use of domestic crude by refiners much beyond its current level, EIA retained Turner, Mason & Company (TM) to provide an analysis of the implications of increasing domestic light tight oil production for the U.S. refining, focusing on
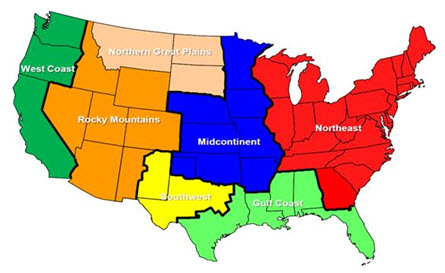
regional crude supply/demand balances
refinery crude slates
operations
capital investment
product yields
crude oil exports/imports
petroleum product exports
infrastructure constraints and expansions
crude oil price relationship
The TM report is intended to be considered in the context of prior and forthcoming EIA analyses. TM was asked to consider likely refining responses to specific crude production scenarios, both with and without current limitations on crude oil exports. In this regard, the TM study goes beyond the recently published EIA report on Technical Options for Processing Additional Light Tight Oil Volumes within the United States, which focused on technical options for the U.S. refining industry to process additional volumes of light tight oil.
Given their focus on refining, the TM report and this paper summarizing its context and findings do not address all key questions related to the implications of crude export policy choices. For example, the TM report uses assumed scenarios of domestic crude production provided by EIA and does not consider how possible feedback from crude export policies on domestic crude oil prices could, in turn, potentially affect domestic crude production levels. Similarly, the report does not consider international market arbitrage on crude or products; or international refinery competitive analysis to support increased U.S. product exports. Some of these issues will be considered in forthcoming EIA efforts.
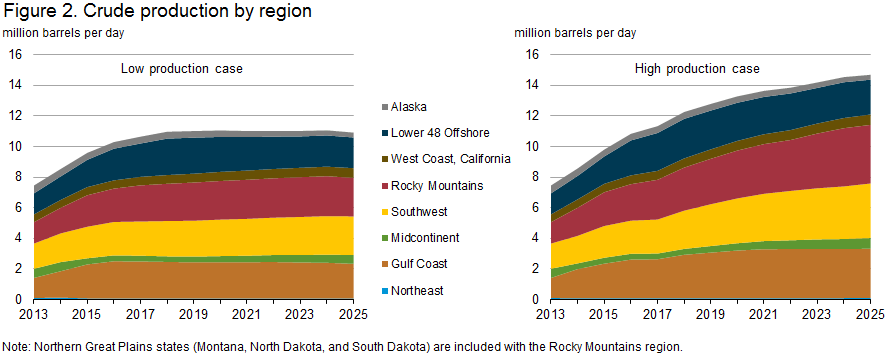
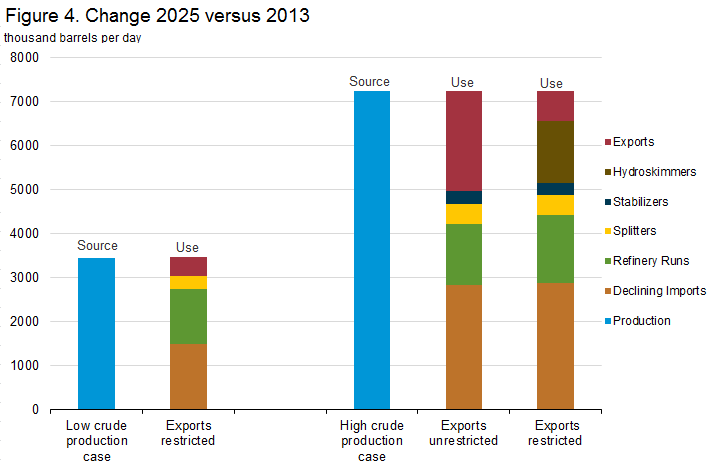
In all three scenarios developed by TM, increasing domestic crude oil production leads to a decline in crude imports, an increase in refinery runs, new investments to expand refinery capacity, and higher crude and refined petroleum product exports. However, the magnitudes of the changes, which are tabulated in Table 3, vary across the scenarios.
2.2. LOW PRODUCTION CASE
In the low production case, by 2025, the U.S. refinery system accommodates 3.5 million bbl/d of incremental (relative to a 2013 baseline) light crude production by investing $1.8 billion in new, less sophisticated processing units, i.e., splitters. This is in addition to the already announced investment to expand and debottleneck existing capacity, some of which has already been completed. A list of these announced projects is provided in the report’s Input Table 5. The incremental production is absorbed by reducing crude imports by 1.5 million bbl/d; increasing refinery runs by 1.3 million bbl/d day; increasing crude exports by 0.4 bbl/d; and processing 0.3 bbl/d of crude in the new splitter units. The increase in crude runs at domestic refineries results in higher U.S. net exports of refined products, based on the assumption across all cases that U.S. refineries remain competitive in the global market. The price of U.S. crude WTI does not change relative to the price of global benchmark Brent as the U.S. refining system does not require significant new capacity investments beyond that which has already been planned.
Table 2. Crude quality types
| Crude Oil Type |
API Gravity (degrees) |
Sulfur Content (wt. %) |
| API 50+ |
API>=50 |
<0.5 |
| API 40-50 sweet |
40<=API<50 |
<0.5 |
| API 35-40 sweet |
35<=API<40 |
<0.5 |
| API 35+ sour |
35<=API |
>=0.5 |
| API 27-35 med-sour |
27<=API<35 |
<1.1 |
| API 27-35 sour |
27<=API<35 |
>=1.1 |
| California |
API<27 |
1.1-2.6 |
| API<27 sweet |
API<27 |
<1.1 |
| API<27 sour |
API<27 |
>=1.1 |
2.3. HIGH PRODUCTION, CURRENT CRUDE EXPORT RESTRICTIONS CASE
In the high resource case and with no changes to current export restrictions, by 2025, additional processing capacity investment is required to absorb 7.2 million bbl/d of incremental (relative to a 2013 baseline) domestic light crude production. An estimated $11.0 billion dollars is invested to expand U.S. processing capacity by 2.4 million bbl/d in the form of new stabilizers, splitters, and hydroskimming refining capacity, which combine distillation and basic upgrading units. This is in addition to the already announced plans to expand and debottleneck existing capacity. The 0.4 bbl/d crude processing capacity expansions at existing refineries, combined with an increase in utilization, increases crude runs at existing refineries by 10% to 16.5 million bbl/d. By 2025, the increase in crude runs results in net refined product exports of 4.5 million bbl/d, an increase of 3.4 million bbl/d compared with 2013. Crude exports increase modestly, limited by the volume of U.S. crude that Canadian refineries can absorb, but crude imports decline by 37%. Imports of most all grades of crude except heavy sour crude decline to zero. The price of WTI crude oil declines relative to Brent reflecting the price discount required to incentivize incremental U.S. refiner investment needed to process higher volumes of light crude oil. The Brent-WTI spread increases to $18/bbl in 2018 and then falls to $12.60/bbl in 2022 and remains between $12/bbl and $13/bbl through 2025, reflecting the costs of hydroskimming refinery investments.
2.4. HIGH PRODUCTION, NO CRUDE EXPORT RESTRICTIONS CASE
When the high resource case is considered in a scenario without crude export restrictions, crude exports increase to 2.4 million bb/d in 2025. Domestic processing capacity also increases, but to a significantly lesser extent than in the high production case with current crude export restrictions, as $2.3 billion is invested to build 0.8 million bbl/d of new stabilizer and splitter capacity. More costly hydroskimming refineries are not built, because the ability to export crude oil prevents the price of WTI from declining to a level that would support such investment. Crude imports decline, falling by 36% from 7.8 million bbl/d in 2013 to 4.9 million bbl/d in 2025, as refiners make the same adjustments to back out light and medium crude imports as in the high production case with current export restrictions, run their refineries at high utilization rates, and process light oil through splitters.
Table 3. Scenario results
| |
Low production/crude exports restricted |
High production/crude exports unrestricted |
High production/crude exports restricted |
| Crude production |
| 2025 vs 2013 |
+3.5 million bbl/d |
+7.2 million bbl/d |
+7.2 million bbl/d |
| 2025 vs. 2013 % change |
46% higher |
97% higher |
97% higher |
| 2025 production |
10.9 million bbl/d |
14.7 million bbl/d |
14.7 million bbl/d |
| Crude imports |
| 2025 vs 2013 |
-1.5 milliion bbl/d |
-2.8 million bbl/d |
-2.9 million bbl/d |
| 2025 vs 2013 % change |
19% lower |
36% lower |
37% lower |
| 2025 imports |
6.3 million bbl/d |
4.9 milliion bbl/d |
4.9 million bbl/d |
| Existing refinery crude runs (a) |
| 2025 vs 2013 |
+1.3 million bbl/d
|
+1.4 million bbl/d
|
+1.5 million bbl/d
|
| 2025 vs 2013 % change |
8% higher |
9% higher |
10% higher |
| 2025 refinery runs |
16.3 million bbl/d |
16.4 million bbl/d |
16.5 million bbl/d |
| New refinery unit runs (b) |
| 2025 vs 2013 inputs |
+0.3 million bbl/d |
+0.7 million bbl/d |
+2.1 million bbl/d |
| Crude exports |
| 2025 vs 2013 |
+0.4 million bbl/d |
+2.3 million bbl/d |
+0.7 million bbl/d |
| 2025 crude exports |
0.6 million bbl/d |
2.4 million bbl/d |
0.8 million bbl/d |
| |
| Existing refinery investment (c) |
| Total capacity added |
0.4 million bbl/d |
0.4 million bbl/d |
0.4 million bbl/d |
| New refinery unit investment (d) |
| Dollars spent |
$1.8 billion |
$2.3 billion |
$11.0 billion |
| Total capacity added |
0.5 million bbl/d |
0.8 million bbl/d |
2.4 million bbl/d |
| Net refined product exports (e) |
| 2025 vs. 2013 |
+2.0 million bbl/d |
+1.8 million bbl/d |
+3.4 million bbl/d |
| 2025 net fin. prod. exports |
3.1 million bbl/d |
2.9 million bbl/d |
4.5 million bbl/d |
| Brent-WTI price spread |
| 2015-2025 average |
$6.78/bbl |
$6.64/bbl |
$13.78/bbl |
|
Notes:
(a) Existing refinery crude runs increase as a result of both increased capacity and utilization.
(b) New refinery units include stabilizers, splitters, and
hydroskimming refining capacity, which combine distillation and basic
upgrading units.
(c) Existing refinery investment for currently planned refinery
projects (which include projects to expand light crude capacity as
well as other substantial refinery unit expansions) total between $6–7
billion, according to Turner Mason estimate.
(d) New refinery unit investment costs for splitters and
hydroskimmers are estimated by EIA based on correspondence with Turner
Mason on March 11, 2015. New refinery unit investment costs for
stabilizers are estimated by EIA based on brownfield stabilizer cost
from Table ES-1 in EIA's Technical Options for Processing Additional
Light Tight Oil Volumes within the United States.
(e) Net refined product exports include gasoline, jet/kerosene,
distillate, residual fuel, aviation gas, petrochemical feedstocks,
naphtha, lubricants, waxes, petroleum coke, refinery gas, and other
miscellaneous products. Net refined product exports do not include
NGL.
Source: U.S. Energy Information Administration, based on Turner Mason & Company.
|
Source: EIA