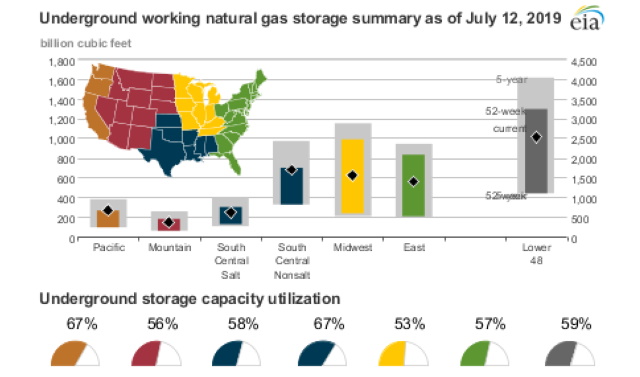
The U.S. Energy Information Administration’s (EIA) weekly estimates of natural gas storage capacity utilization published on July 12, 2019, exceed 50% in all regions for the second straight week. EIA updates estimates of underground storage capacity utilization by region each week in the Natural Gas Storage Dashboard. EIA created this metric to help analysts easily assess how full natural gas storage stocks are by region. The utilization estimate measures the weekly volume of working gas in a region compared with the amount of working gas capacity in a region.
Underground working gas capacity utilization has been rising since April because of faster-than-normal weekly natural gas injections. As a result, natural gas storage stocks reported on July 12 exceeded natural gas stocks from a year ago by about 13%. Rising natural gas stocks in the Pacific and South Central regions have pulled up the national average.
As natural gas storage facilities have filled, a long-running deficit to the five-year average has declined in all regions. Despite these gains, working gas stocks remained 2% to 16% lower than the five-year average in every region of the Lower 48 states as of July 12. Declines in the deficit to the five-year average on a regional basis have largely mirrored the national pattern in most weeks since March 15. The stacked area chart below shows the contribution of each region to the combined deficit to the five-year average reported for the Lower 48 states.
Although each of the regions has significantly reduced its deficit to the five-year average since March 15 and inventories in the Lower 48 states saw deficit reductions in each of the 17 successive weeks, no individual region reduced its deficit to its five-year average in every week. Regional highlights during this period include
- The South Central region accounted for the largest reduction in the deficit to its five-year average. The deficit to the five-year average totaled 67 billion cubic feet (Bcf) for the week ending July 12, compared with 228 Bcf reported for the week ending March 15—a gain of 161 Bcf. Nonsalt facilities in the South Central region accounted for most of the incremental gains in stocks (139 Bcf).
- The Midwest region reduced the deficit to its five-year average by 99 Bcf. The deficit fell from 106 Bcf on March 15 to 7 Bcf on July 12. The Midwest reduced its deficit to the five-year average despite reporting withdrawals from working gas until April 5.
- The inventory deficit to the five-year average decreased in the Pacific region from 104 Bcf on March 15 to 25 Bcf on July 12. Mandatory operational restrictions have reduced working gas capacity in Southern California by more than 50 Bcf in the aftermath of the Aliso Canyon Natural Gas Storage Facility accident in October 2015.
- The Mountain region made smallest reductions (both in absolute and relative terms) to its deficit to the five-year average, dropping from 53 Bcf on March 15 to 22 Bcf on July 12.
Working gas deficit to five-year average, by region, (September 29, 2017- present)

Source: U.S. Energy Information Administration, Weekly Natural Gas Storage Report
Source: EIA