The global shipping crisis continued through April 2022 with another year-over-year record in container import volume versus 2021. COVID-related shutdowns in China continue to spread, but do not appear to be having an impact on overall U.S. container import volumes. Neither has the Russia/Ukraine conflict or inflation. The May update of the logistics metrics Descartes is tracking continues to point to congestion and challenging global supply chain performance for the rest of 2022.
April continued the record monthly trend for U.S. container import volume.
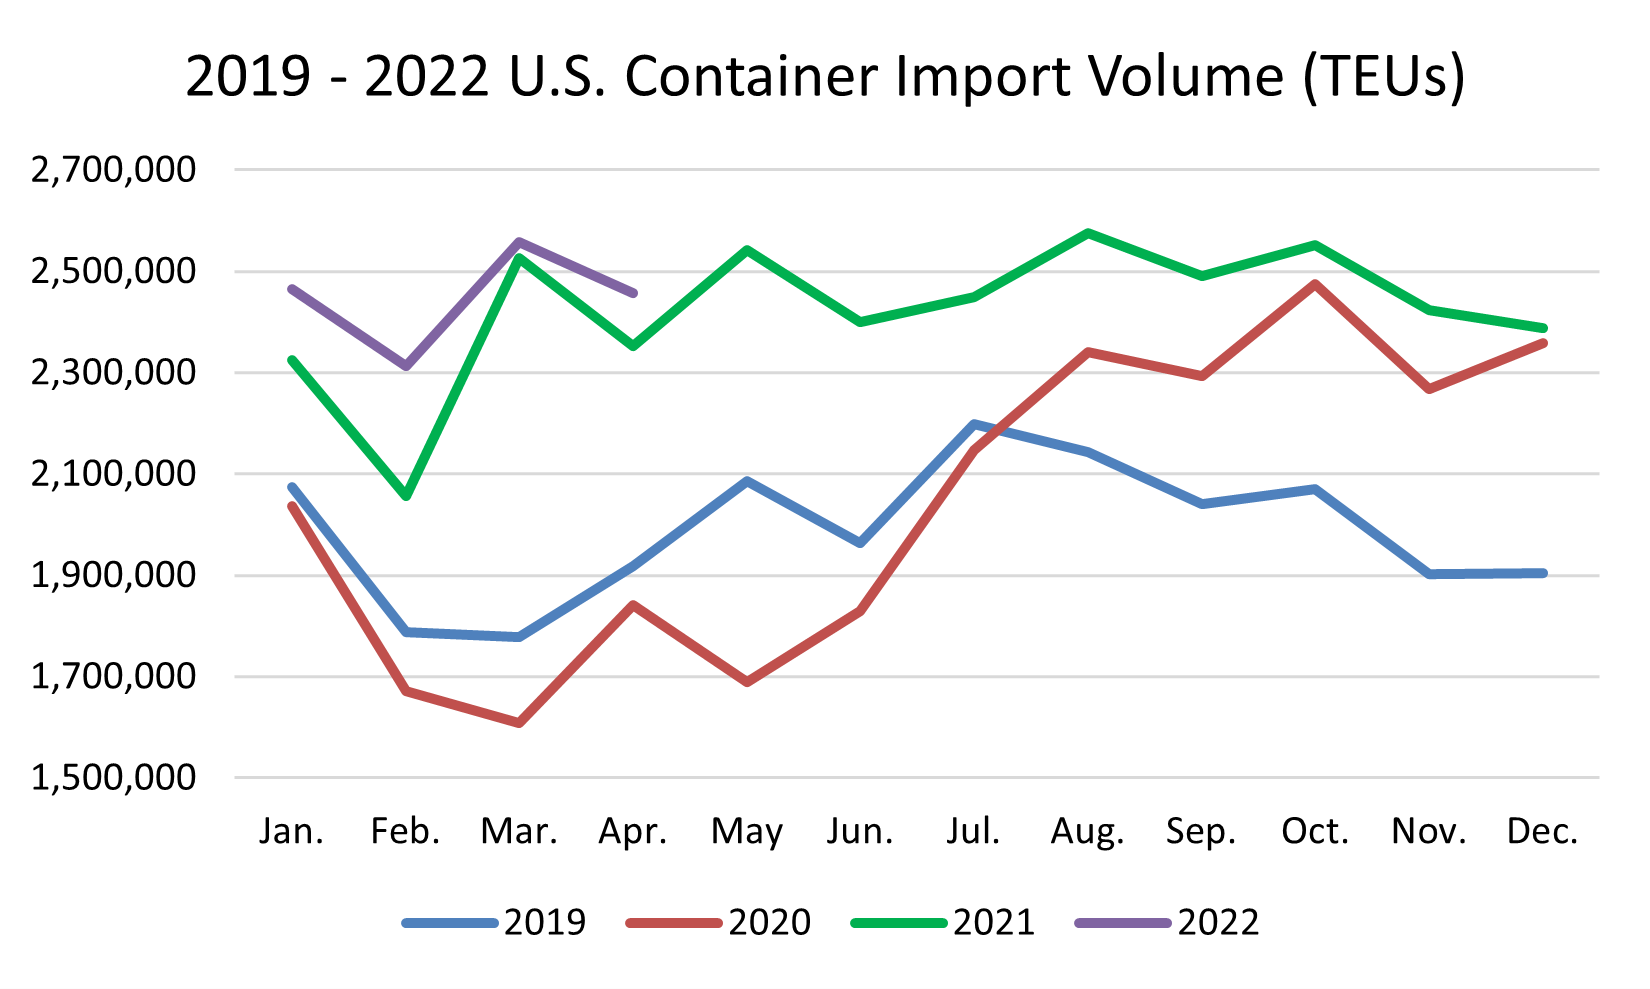
April continued the very strong start to 2022 at 2.47 million container imports into the U.S., which sets another monthly record (see Figure 1). Container import volumes were down 4% from March 2022 but could be considered on par with March imports due to April’s Easter holiday and the month being a day shorter. In contrast to previous years, however, April 2022 container import volumes were up 4% from April 2021 and 28% from pre-pandemic April 2019.
April U.S. container import volumes from China were down 2.4% compared to March 2022, but up 0.8% from April 2021. Again, container imports from China can be considered comparable to March given the Easter holiday and that April is one day shorter. Import volumes from Vietnam, India, Taiwan, South Korea and Thailand had similar performance to China.
The great West to East coast shift story continues.
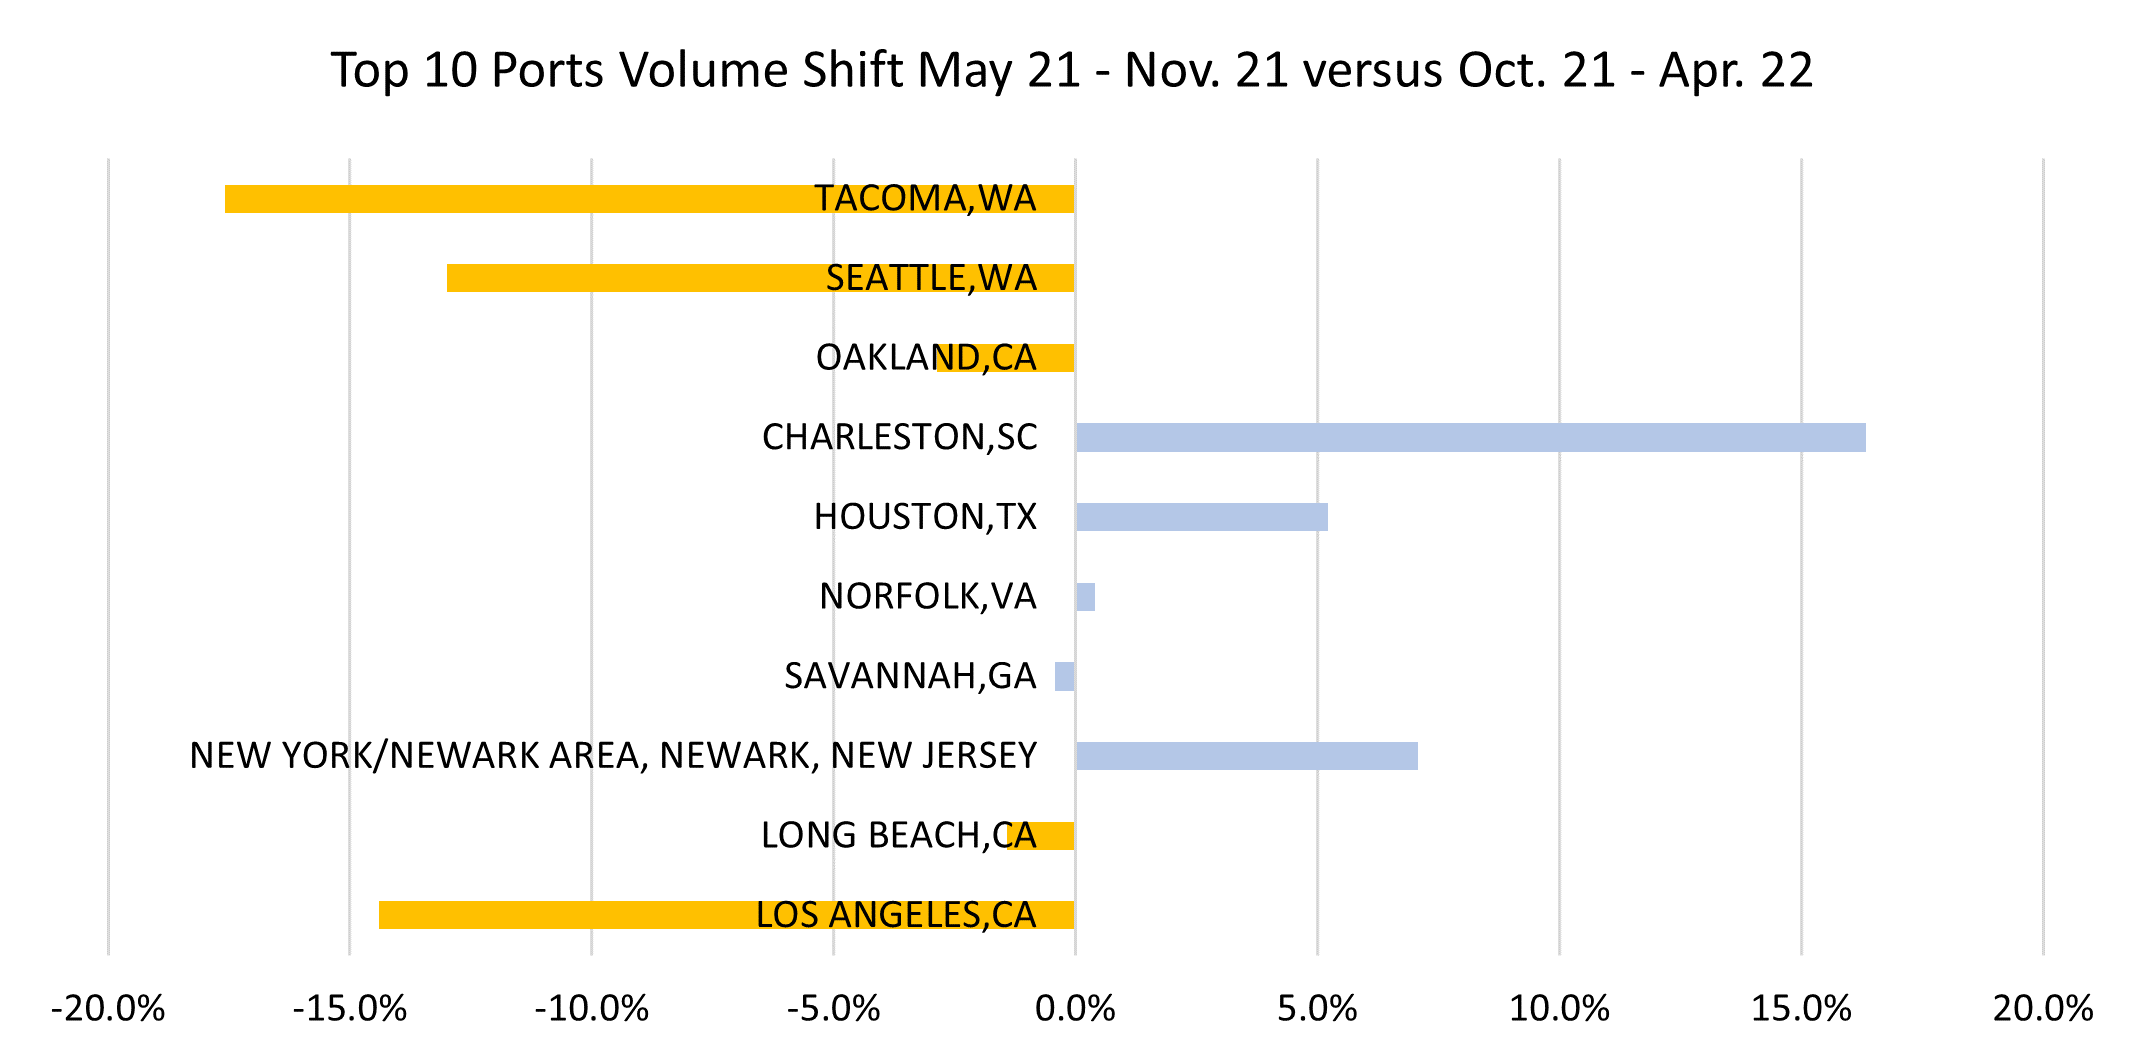
Volumes between West and East Coast ports shifted again in April 2022 compared to March 2022. Comparing the top five West Coast ports to the top five East Coast ports in April 2022 versus March 2022 shows that, of the total import container volume, the East increased to 45.4% of the total while the West represented 41.2% with all West Coast ports except Seattle combining to process 82,000 less containers. In March, the split was East Coast 41.4% and West Coast 45.0%. Also interesting is the share of volume shifting away from the top 10 ports over the last 11 months. In April 2021, the top 10 ports represented 86.9% of all volume but, in April 2022, that was only 86.5%. Comparing five month periods as shown in Figure 2, all top West Coast ports (orange) declined in volume while all top East Coast ports (blue) increased, except Savannah. The Port of Los Angeles remained in the top spot at 442,912 TEUs in April, shrinking ~33,000 TEUs versus March and still well below its high of 530,432 TEUs in May 2021. The Port of New York/New Jersey was a close second at 441,556 TEUs and very consistent with April volumes.
Continued improvement in port performance, but we are not out of the woods.
Almost across the board, ports reduced delays in April (see Figure 3). This is encouraging since U.S. container import volume is still at record levels; however, every major port still has 10+ day delays with one minor exception: Long Beach (9.7 days).

Bear in mind that, as long as monthly U.S. container import volumes are above 2.4M TEUs, port congestion issues will persist until infrastructure changes are made. Port congestion became a significant issue when the U.S. consistently exceeded import volumes of 2.4 million TEUs per month starting in April 2021. To put this in context, 2021 container import volume was 18% higher than 2020 and 22% higher than 2019—and, so far, 2022 is higher than 2021. This continued volume increase is hard for U.S. infrastructure to efficiently absorb without capital investment to improve container processing capacity at ports.
Waiting for the export “roller coaster” from China.
As has widely been reported, China’s “zero-COVID” policy has locked down numerous cities and ports starting in February 2022. One conclusion that could be drawn from the April U.S. container import numbers is that, despite these lockdowns, China exported a great deal of freight to the U.S. as of a month plus ago (e.g., mid-February to early March). We are still waiting to see if and when the lockdowns impact overall U.S container import shipment volumes. This timing, however, could start to coincide with peak season ocean shipping, artificially making port congestion worse in the second half of the year. At a minimum, it will make logistics and inventory planning much more complicated and fraught with errors.
What to watch in 2022.
The big question on the minds of importers and LSPs is when, or if, a decline in import volume will occur in 2022. In addition, several significant one-time events could exacerbate the ability to move goods globally. Here’s what Descartes will be watching:
• Monthly TEU volumes between 2.4M and 2.6M. This consistently high level will continue to stress ports and inland logistics until infrastructure can be enhanced. April U.S. container import volume was still robust at almost 2.5M TEUs.
• Port wait times. If they decrease, it’s an indication of improved port processing capabilities or that the demand for goods and logistics services is declining. There was another reduction in wait times in April and, considering the continued high container import volume, ports appear to be more efficiently moving cargo.
• Continuing impact of the pandemic. New variants are driving shockwaves through global supply chains. Whether it’s cities in China on full lockdown, swaths of employees out sick or country-based restrictions, a lack of resources will constrain the ability of supply chains to recover. COVID lockdowns In China expanded in April, but their impact on overall import volumes has yet to be seen.
• Key economic indicators such as the inflation rate, monthly BLS Jobs Report, FRED Inventory to Sales Ratio and FRED Personal Consumption Expenditure: Durable Goods. A fundamental change in consumer buying behavior from services to goods occurred early in the pandemic and was the force behind the dramatic increase in U.S. container import volumes over the last two years. The May jobs report showed another month of solid growth. The latest FRED numbers released in early May (but are from early March) show them to be relatively consistent with the last 12+ months.
• ILWU contract negotiations. The negotiations could be uneventful or they could turn port operations and supply chains upside down in the first half of 2022 and possibly beyond. No change in April, but positive signs from the union that there will be earnest negotiations starting in May.
• Inflation and the Russia/Ukraine conflict. Inflation may be the only way to slow down the strong U.S. economy and ultimately help to alleviate the global logistics capacity-related problems that exist. In early May, inflation declined slightly but still remained high and the effect of the Russia/Ukraine conflict on fuel costs continues.
April was yet another record.
April U.S. container import volumes set yet another record versus 2021; however, China’s COVID lockdown policy could extend today’s global supply chain challenges and drive greater uncertainty. This data reaffirms that it will be some time before the pressure on supply chains and logistics operations begins to lift. Descartes will continue to highlight key Descartes Datamyne, U.S. government and industry data in the coming months to provide insight into the global shipping crisis. Our current perspectives and recommendations are largely unchanged:
Short-term:
• Evaluate the impact of inflation and the Russia/Ukraine conflict on logistics costs and capacity constraints. Ensure that key trading partners are not on sanctions lists.
• Shipping capacity constrained? Rationalize SKUs to ship higher velocity and margin goods to maximize profitability.
• Focus on keeping the supply chain resources you have, especially drivers. The old adage “a bird in the hand is worth more than two in the bush” definitely applies here. Building trips to reduce stress and improve quality of life to retain drivers is now as or more important than wage increases.
• Accelerate inventory coming in through West Coast ports now or use alternate ports as a hedge against upcoming ILWU contract negotiations.
• Track the spread of COVID variants to determine when they will hit critical parts of the supply chain. As COVID variants come in waves, they travel across the globe unevenly and create disruptions. Use tracking sites such as The New York Times to better understand their path and impact on global supply chains.
Near-term:
• Shift the movement of goods to less congested transportation lanes to improve supply chain velocity and reliability. Total transit time is important, but so is supply chain predictability. Evaluate alternative transportation lanes into the U.S., including entry through northern and southern borders and inland ports.
Long-term:
• Evaluate supplier and factory location density to mitigate reliance on over-taxed trade lanes and regions of the globe that are potentials for conflict. Density creates economy of scale but also risk, and the pandemic and subsequent logistics capacity crisis highlight the downside. Conflicts do not happen “overnight” so now is the time to address this potentially business disrupting issue.
Source: The Descartes Systems Group Inc