Trade will continue to expand but at a more moderate pace than previously forecast. The WTO anticipates growth in merchandise trade volume of 3.9% in 2018, with trade expansion slowing further to 3.7% in 2019. The new forecast for 2018 is below the WTO’s 12 April estimate of 4.4% but falls within the 3.1% to 5.5% growth range indicated at that time. Trade growth in 2018 is now most likely to fall within a range from 3.4% to 4.4% (Table 1).
Some of the downside risks identified in the April press release have since materialized, most notably a rise in actual and proposed trade measures targeting a variety of exports from large economies. The direct economic effects of these measures have been modest to date but the uncertainty they generate may already be having an impact through reduced investment spending. Monetary policy tightening in developed economies has also contributed to volatility in exchange rates and may continue to do so in the coming months.
WTO Director General Roberto Azevêdo said: “While trade growth remains strong, this downgrade reflects the heightened tensions that we are seeing between major trading partners. More than ever, it is critical for governments to work through their differences and show restraint. The WTO will continue to support those efforts and ensure that trade remains a driver of better living standards, growth and job creation around the globe.”
The updated trade forecast is based on expectations of world real GDP growth at market exchange rates of 3.1% in 2018 and 2.9% in 2019. This implies a ratio of trade growth to GDP growth of 1.3 in both years.
Trade policy measures are far from the only risk to the forecast. Developing and emerging economies could experience capital outflows and financial contagion as developed countries raise interest rates, with negative consequences for trade. Geopolitical tensions could threaten resource supplies and upset production networks in certain regions. Finally, structural factors such as the rebalancing of the Chinese economy away from investment and toward consumption are still present and could weigh on import demand due to the high import content of investment. Overall, risks to the forecast are considerable and heavily weighted to the downside.
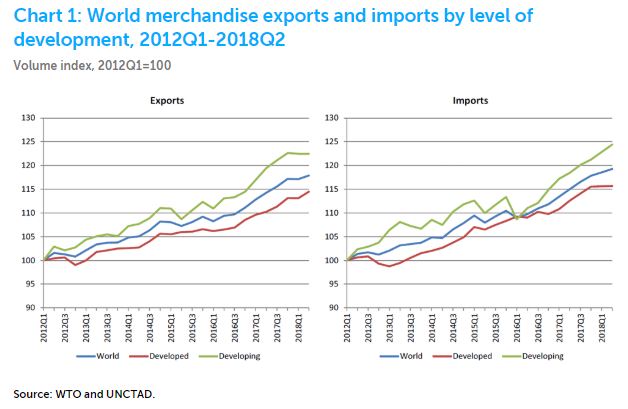
Charts 1 and 2 show seasonally-adjusted export and import volumes broken down by level of development and geographic region. In the first half of 2018, world merchandise trade was up 3.8% compared to the same period in the previous year. Exports of developed economies rose 3.5% during the same period while shipments from developing economies increased by 3.6%. On the import side, developed economies recorded year-on-year growth of 3.5% in the first half of 2018 while developing countries registered an increase of 4.9%. Imports of developed economies have generally been flat in 2018 while exports of developing economies plateaued similarly.
All geographical regions recorded positive year-on-year trade growth in both exports and imports in the first half of 2018, but some regions performed better than others. North America saw the fastest export growth during this period at 4.8%, followed by Asia at 4.2% and Europe at 2.8%. Exports of Other regions (comprising Africa, the Middle East and the Commonwealth of Independent States including associate and former member States) increased by 2.7% while those of South America were up 1.1%. Asia had the fastest import growth (6.1%) followed by South America (5.5%), North America (4.8%), Europe (2.9%) and Other regions (0.5%).
Prices of energy commodities including oil have risen 33% for the year-to-date through August compared to last year, boosting export revenues of commodity exporters. This has not yet translated into strong import demand in resource-rich regions, as one might expect. Meanwhile the US dollar has appreciated by 8.4% in real effective terms since January of 2018.

The downward revision to the trade forecast is consistent with the WTO’s World Trade Outlook Indicator (WTOI), which has signalled slowing trade momentum since the first quarter of 2018. The WTOI combines several leading indicators for trade into a single composite indicator. Components include container port throughput, air freight shipments, export orders, automobile sales and trade in electronic components and raw materials. The export orders component, derived from purchasing mangers’ indices, has fallen from 54.1 in January to 50.3 in August, just above the baseline value of 50.0 separating expansion from contraction (Chart 3).

A separate indicator of economic policy uncertainty is based on the frequency of keywords related to uncertainty in press reports (Chart 4). The index value rose from 113 to 227 between January and July before falling back to 205 in August. Although uncertainty has eased slightly recently, it remains higher than during the global financial crisis of 2008. To the extent that economic uncertainty deters investment it can have a negative impact on trade since capital goods tend to have high import content.

The trade figures above refer to merchandise trade in volume terms, but trade in current US dollar terms is also relevant. This is illustrated by Chart 5, which shows growth of merchandise exports and imports of selected economies in current US dollar terms. US exports and imports remain strong despite the recent appreciation of the US dollar. Note that nominal trade statistics should be interpreted with caution as they may be strongly influenced by prices and exchange rates.
Table 1: Merchandise trade volume and real GDP, 2014-2019 a
Annual % change

a Figures for 2018 and 2019 are projections.
b Average of exports and imports.
c Includes the Commonwealth of Independent States (CIS), including associate and former member States.
d Other regions comprise Africa, Middle East and Commonwealth of Independent States (CIS).
Sources: WTO and UNCTAD for trade, consensus estimates for GDP.
Chart 5: Merchandise exports and imports of selected economies, January 2016-July 2018
(Year-on-year percentage change in current dollar values)

a January and February averaged to minimize distortions due to lunar new year.
Sources: IMF International Financial Statistics, Global Trade Information Services GTA database, national statistics.
Source: World Trade Organization (WTO)