Expenditures for delivered energy in the United States in 2015 totaled $1.127 trillion, a 20% decrease in real terms from 2014, according to recently released data from EIA's State Energy Data System. Adjusted for inflation, total energy expenditures in 2015 were the lowest since 2004. Total energy expenditures, expressed as a percent of the United States gross domestic product, were 6.2% in 2015, the lowest since 2002.
About 45% of total U.S. energy expenditures in 2015 were in the transportation sector and mainly included fuels used for automobiles, rail, aircraft, and waterborne vehicles such as ships and barges. The 28% decline in transportation sector expenditures between 2014 and 2015 was the result of lower fuel prices, as energy use in the sector increased by about 1%.

Source: U.S. Energy Information Administration, State Energy Data System
Declines in petroleum product prices accounted for almost all of the overall price decline, as petroleum-based fuels accounted for 97% of total consumption in the transportation sector in 2015. Petroleum prices were at their lowest level since 2009, while natural gas prices were at their lowest level since 2002. In total, the U.S. spent about $507 billion on transportation sector energy in 2015.
Despite a growing economy, the percentage of total energy expenditures per current-dollar gross domestic product (GDP) decreased for the fourth consecutive year. The decline from 2014 to 2015 was the largest decline since the 2008–2009 recession. However, during the recession, U.S. real GDP decreased by about 2.8%. In 2015, year-over-year U.S. real GDP increased by about 2.6%.

Source: U.S. Energy Information Administration, State Energy Data System
Expenditures for delivered energy in the United States in 2015 totaled $1.127 trillion, a 20% decrease in real terms from 2014, according to recently released data from EIA's State Energy Data System. Adjusted for inflation, total energy expenditures in 2015 were the lowest since 2004. Total energy expenditures, expressed as a percent of the United States gross domestic product, were 6.2% in 2015, the lowest since 2002.
About 45% of total U.S. energy expenditures in 2015 were in the transportation sector and mainly included fuels used for automobiles, rail, aircraft, and waterborne vehicles such as ships and barges. The 28% decline in transportation sector expenditures between 2014 and 2015 was the result of lower fuel prices, as energy use in the sector increased by about 1%.
Declines in petroleum product prices accounted for almost all of the overall price decline, as petroleum-based fuels accounted for 97% of total consumption in the transportation sector in 2015. Petroleum prices were at their lowest level since 2009, while natural gas prices were at their lowest level since 2002. In total, the U.S. spent about $507 billion on transportation sector energy in 2015.
Despite a growing economy, the percentage of total energy expenditures per current-dollar gross domestic product (GDP) decreased for the fourth consecutive year. The decline from 2014 to 2015 was the largest decline since the 2008–2009 recession. However, during the recession, U.S. real GDP decreased by about 2.8%. In 2015, year-over-year U.S. real GDP increased by about 2.6%.
California had the highest total energy expenditures of any state and accounted for 11% of total U.S. energy expenditures in 2015. California's transportation energy expenditures alone accounted for nearly 6% of total U.S. energy expenditures and were larger than the total energy expenditures for every other state except Texas. The transportation sector had the largest share of energy expenditures in 47 of the 51 states, accounting for more than half of energy expenditures in 7 states.
Only in Connecticut, Rhode Island, Louisiana, and the District of Columbia did a sector other than transportation account for the largest share of total energy expenditures in 2015. Connecticut and Rhode Island led the nation with residential sector energy expenditures of 36% and 35%, respectively. Overall, the 13 highest state shares of residential sector energy expenditures were all located along the East Coast.
Louisiana, which is among the top 10 states in production of both crude oil and natural gas, spent about $10.7 billion on industrial sector energy, accounting for nearly half of its total energy expenditures. The District of Columbia spent about 55% of energy-related expenditures in the commercial sector in 2015, more than twice the commercial sector share of the next highest state, New York.
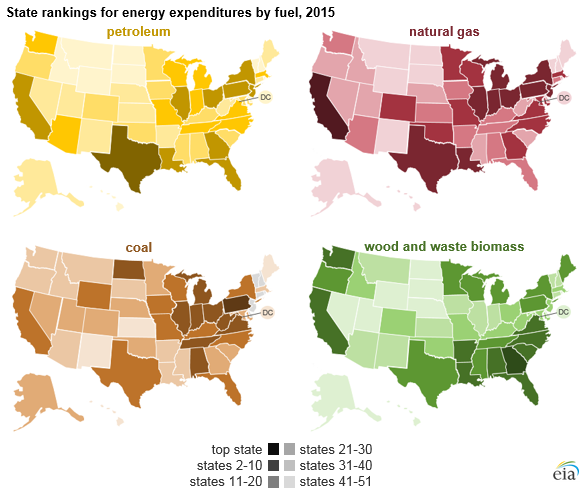
Source: U.S. Energy Information Administration, State Energy Data System
By fuel type, Texas led all states in total petroleum energy expenditures with $75 billion in 2015. California spent the most on natural gas ($10.7 billion), Pennsylvania the most on coal ($800 million), and Georgia the most on wood and waste biomass ($600 million).
For complete state estimates of total end-use energy expenditures by sector and by fuel type and additional state rankings, see EIA's recently updated State Energy Data System.
Source: EIA