The recent decline in crude oil prices has created the potential for
weaker crude oil production. EIA's Drilling Productivity Report (DPR)
includes indicators that provide details on the effect low prices may
have on tight oil production, which accounts for 56% of total U.S. oil
production. Analyzing these indicators and the
changes in oil production
following the drop in crude oil prices during the 2008-09 recession may
offer some insight into possible near-term oil production trends.

Source: North Dakota Department of Mineral Resources, Bloomberg
The
price of West Texas Intermediate (WTI) crude oil delivered to Cushing,
Oklahoma declined more than 31% from June to November 26 and another 7%
after the late November announcement of the Organization of the
Petroleum Exporting Countries (OPEC) decision to maintain the current
production level. At $60 per barrel, the current price of oil is likely
approaching or already below the expected per-barrel costs of some of
the most expensive U.S. tight oil projects.
Some of the most
active production fields in the country are in North Dakota. Indicators
tracked by the DPR and North Dakota's Department of Mineral Resources
(DMR) cover much of the exploration and production process, from
planning to production. These indicators include:
• Permits. Before
drilling begins, producers must sign lease contracts and apply for
permits to drill exploration and development wells.
• Rig movement. Drilling rigs must be secured and moved to permitted locations.
• Spuds. Spudding is the term for the ground-breaking process of a new
drilling project. In North Dakota, the spud count is a count of new
wells drilled.
Based on the most recent data released by North
Dakota's DMR, drilling and production activities in the state have not
slowed, despite the significant decline in domestic crude oil prices
since July 2014. Oil production in September 2014—the latest data
available—rose 5% from the prior month.
The number of permits
issued in October 2014 was 28% above the September level, but it dropped
30% in November. However, when normalized based on the number of
business days during those months, October is only 17% above September's
level, and November is only 10% lower than October.

Source: North Dakota Department of Mineral Resources
Although
the current economic situation is fundamentally different from the
recession of 2008-09, changes in oil prices, production indicators, and
production volumes during the recession may offer insight into what may
happen next with U.S. shale oil production.
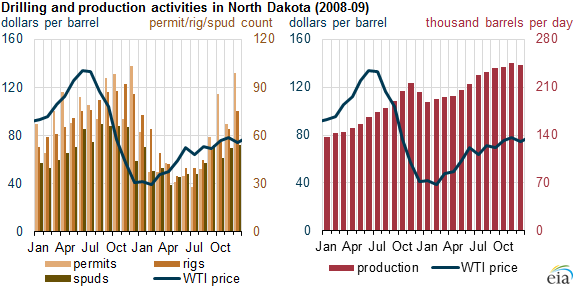
Source: North Dakota Department of Mineral Resources, Bloomberg
During
the 2008-09 recession, monthly average WTI prices fell by 71% to $39.09
per barrel between June 2008 and February 2009. At the time, shale oil
production in North Dakota was still in the testing phase and thus
relatively expensive. Drilling and production continued to increase
until November 2008, when WTI prices dropped below $57 per barrel. Below
$57 per barrel, the number of projects that were interrupted increased
significantly, with the number of permits declining 73% from December
2008 to July 2009, the number of rigs declining 62% from November 2008
to May 2009, and the number of spuds declining 55% from November 2008 to
April 2009. However, the decline in production was not nearly as
dramatic, falling only 13% from November 2008 to January 2009, after
which time production began increasing.
Looking forward, EIA
expects 2015 drilling activity to decline as a result of less-attractive
economic returns in some areas of both emerging and mature oil
production regions. Many companies will redirect investment away from
marginal exploration and research drilling and into core areas of major
tight oil plays. However, projected oil prices remain high enough to
support development drilling activity in the Bakken, Eagle Ford,
Niobrara, and Permian Basin, which contribute the majority of U.S. oil
production growth.
EIA expects U.S. crude oil production to
average 9.3 million barrels per day (bbl/d) in 2015, up 0.7 million
bbl/d from 2014, but down from expected growth of 0.9 million bbl/d in
last month's Short-Term Energy Outlook. However, all of the decrease in
forecast production growth comes in the second half of 2015. EIA revised
production growth downward by 140,000 bbl/d and 270,000 bbl/d in the
third and fourth quarters, respectively, compared with the previous
forecast. However, this forecast remains particularly sensitive to
actual prices available at the wellhead and drilling economics that vary
across regions and operators.
Source: EIA